


Get the weekly summary of crypto market analysis, news, and forecasts! This Week’s Summary The crypto market ends the week at a total market capitalization of $2,17 trillion. Bitcoin continues to trade at around $62,300. Ethereum experiences no changes and stagnates at around $2,400. XRP is down by 2%, Solana by 1%, and Dogecoin by 3%. Almost all altcoins are trading in the red, with very few exceptions. The DeFi sector decreased the total value of protocols (TVL) to around…


Kaspa (KAS) Price Slips Below Key Level Amid Long Liquidations
108 views

Only a few altcoins have been able to outperform Bitcoin (BTC) this year. But if there is one that has continuously remained in that fold, it is Kaspa (KAS), the project that utilizes the same Proof-of-Work (PoW) mechanism as Bitcoin.
While KAS price has increased over 400% in the last 365 days, recent data shows it may struggle to regain the momentum.
Kaspa Faces Imminent Breakdown Due to Wipeout Positions
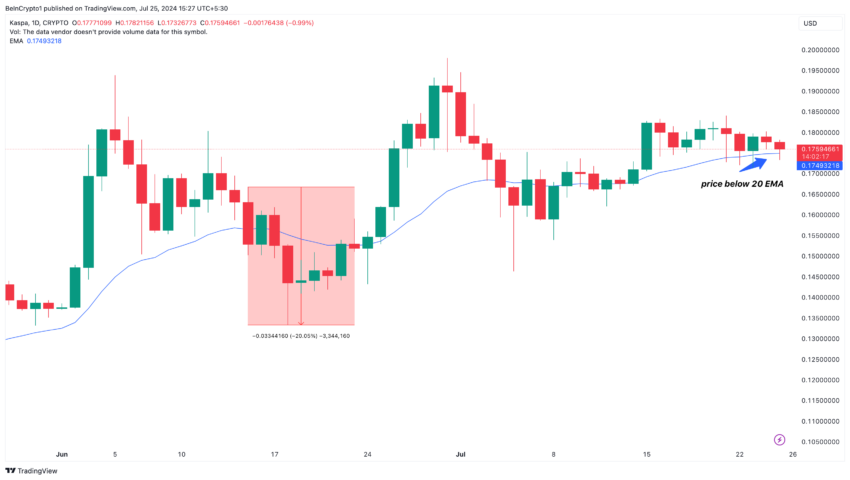
Kaspa’s current position below the Exponential Moving Average (EMA) supports the above point.
This indicator highlights price changes and provides insights into a cryptocurrency’s short—and long-term trends. This analysis focuses on the short-term EMA—specifically, the 20 EMA (blue).
For most of July, KAS traded above the EMA, indicating a bullish trend. This was one reason the value reached $0.18 earlier. At press time, the cryptocurrency trades below the 20 EMA, suggesting a bearish trend. The last time KAS’ price dropped by 20%, it reached $0.13.
Read More: Kaspa (KAS): A Detailed Guide to What It Is and How It Works
Following the recent decline, long liquidation in the market is fifteen times that of shorts. Liquidation occurs when an exchange forcefully closes a trading position. This is because there is no longer enough margin to cover the position, meaning the trade has to be settled.
Therefore, the rise in long liquidations proves that the KAS decline negatively affected traders who placed bets on a price increase. However, it is worth noting that liquidation can also affect price trends.
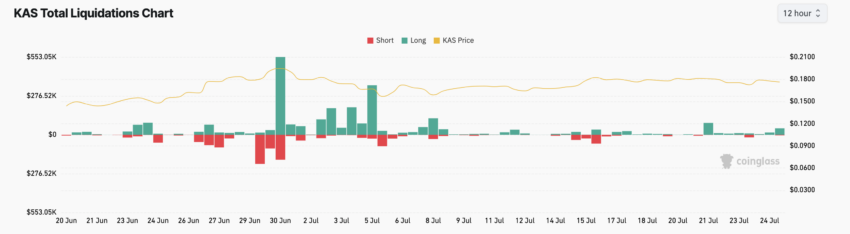
From a trading point of view, a rise in long liquidation dumps into the underlying support. As such, Kaspa’s next move could be a notable breakdown below the press time value.
KAS Price Prediction: A Pullback to $0.15 Could Be Next
Further assessment of the daily KAS/USD chart shows weakness in the bullish trend. This is the indication the Directional Movement Index (MDI) reveals. The DMI simply measures the strength and direction of a trend.
As of this writing, the +DMI (green) is down, while the – DMI (red) is trying to rise above -17.22. If the negative end rises above the positive directional strength, the price of KAS may drop as it offers more power to the downtrend.
In addition, the Average Directional Index (ADX) yellow indicates that the overall cryptocurrency trend is weak. Typically, a reading of 25 or above for the ADX (yellow) suggests strong directional movement.
Read More: Kaspa (KAS) Price Prediction 2024/2025/2030
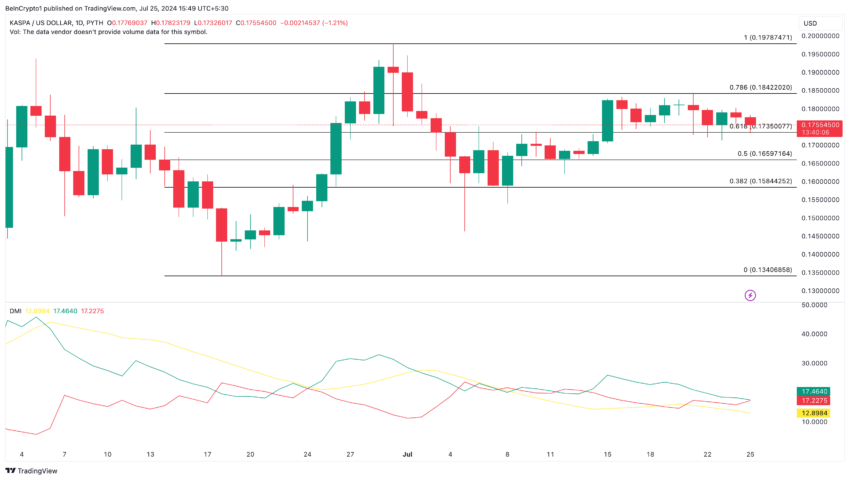
But at press time, it is lower. Thus, KAS’ price may either consolidate or trend downward. Should selling pressure increase, the chart above shows that the crypto may experience a nominal pullback to the 38.2% Fibonacci retracement level, which is at $0.15.
However, BeInCrypto observes that the Kaspa hash rate has been increasing lately. When the hash rate increases, miner costs also increase, which boosts investor confidence and demand for cryptocurrency. If sustained, the bearish bias could be invalidated, and KAS price may jump to $0.19.

Btc
Bitcoin
$62.547
price
price

price change

The post Kaspa (KAS) Price Slips Below Key Level Amid Long Liquidations appeared first on BeInCrypto.
Previous
Altcoin Bull Run Likely as Bitcoin Dominance Drops
Next
Toncoin (TON) Price Faces Crucial Resistance, Hints at Possible Drawdown
Written by
Crypto News
@cryptonews
15945 posts
More author posts
Bitcoin Price Holds Above $63,000 — Here’s The Next Critical Resistance Level
The Bitcoin price has been relatively quiet in October, but things seem to be looking up after the premier cryptocurrency broke the $63,000 mark on Saturday, October 12. However, the crypto has to scale a major resistance level if the current bull run is to get back on track. $64,000 The Resistance Level To Watch: Analyst In a Quicktake post on CryptoQuant, an analyst with the pseudonym ShayanBTC has put forward an interesting prognosis for the Bitcoin price in the…
8 months ago
Analyst Forecasts XRP Bullish Breakout – A 1,000% Opportunity?
XRP is currently testing a crucial resistance level that will shape its price action in the coming weeks. After the euphoria surrounding the Federal Reserve’s interest rate cuts in late September, the market is experiencing uncertainty and anxiety. While some investors remain optimistic, the recent price movements of XRP have led to a sense of caution. Top crypto analyst Amonyx has shared insights into the potential for an unexpected XRP rally. In his analysis, he suggests that the altcoin might…
8 months ago
Analyst Sets $2.50 Target For SUI Following 30% Weekly Gain – Details
Sui (SUI) has been one of the most popular crypto assets of 2024, with notably high market gains and drastic price losses over the year. The altcoin is currently moving sideways following a recent price rally in the last week. As usual, these consolidative movements draw much speculation on the token’s next price action. SUI To Record ATH At $2.50, Analyst Says In an X post on Saturday, market analyst Michaël van de Poppe dropped a new price target for…
8 months ago
Active Dogecoin Addresses Reach Highest Level In 8 Months – Is DOGE About To Rally?
Dogecoin is currently in a consolidation phase following days of sharp volatility and wild price swings. Since the start of October, the meme coin has been trading within a tight sideways range, leaving some investors concerned about whether the anticipated rally for DOGE will ever materialize. The uncertainty in the market has heightened fears that Dogecoin’s price might stagnate further, as bullish momentum seems to have cooled off. However, new data from Santiment offers a glimmer of hope for DOGE…
8 months ago
Forget Dogecoin (DOGE), This New Crypto Will Make DOGE’s 2021 Rally Look Like a Joke
Trends are cyclical and while a few digital coins appeal to the general populace a little more than others, others fade away. Keeping in mind the latest trends, cryptocurrencies such as Dogecoin (DOGE) gained much popularity due to the social media ‘hype’ among clients and endorsements from celebrities, and in the year 2021, it reached its actual deep growth and surprising shots. Nevertheless, with the advancements in the crypto space, there is a new challenger ready and that can do…
8 months ago
This New Cheap Token Under $0.10 Is Set to Make Early Investors Rich, Just Like NEIRO Did Last Month
The field of cryptocurrency is one of the best business opportunities which are expanding rapidly today. So, one of the keys to earning good returns is the ability to concentrate on the area that is about to offer some very attractive investment prospects. All those investors who came to NEIRO last month got the benefit of this increase, changing their reasonable investments to good profits. Now, there is another crypto that is ready to serve similar purposes: Rexas Finance (RXS).…
8 months ago
Publish your own article
Guest post article. Guaranteed publishing with just a few clicks
START PUBLISHING ADVERTISE WITH USBrowse categories
Explore trending topics in the crypto community right now.
Bitcoin
SEC Greenlights Multiple Bitcoin ETFs, Signaling Major Leap for Cryptocurrency Markets
The U.S. Securities and Exchange Commission (SEC) has made a landmark decision by approving 11 spot bitcoin exchange-traded funds (ETFs). This move represents a significant moment in the cryptocurrency industry, marking a shift towards greater institutional adoption and accessibility for investors. The approved ETFs include products from major firms such as BlackRock’s iShares Bitcoin Trust, Grayscale Bitcoin Trust, ARK 21Shares Bitcoin ETF, Bitwise Bitcoin ETP Trust, WisdomTree Bitcoin Fund, Fidelity Wise Origin Bitcoin Trust, VanEck Bitcoin Trust, Invesco Galaxy Bitcoin…
Marius Bogdan Dinu  @bdinu89
@bdinu89
1 year ago ![]() 597 views
597 views
Bitcoin Should be Banned in the United States: Charlie Munger
Berkshire Hathaway’s vice chairman, Charlie Munger, called for a ban on cryptocurrency in the United States on Monday, similar to the one in China. In an op-ed published with the Wall Street Journal, Munger argued that Bitcoin isn’t a currency, commodity, or security, but simply a form of gambling “ with a nearly 100% edge for the house. As such, the enactment of a federal law should ban such things from happening. Munger cited the Chinese communist party’s ban on…
2 years ago ![]() 1.5 k views
1.5 k views
Tesla’s BTC Positions Remained Unchanged in Q4 of 2022
According to a new earning report from automotive manufacturer Tesla, the company did not sell any of its BTC holdings in the fourth quarter of 2022. Amid speculations that the company had traded BTC during the testing bears, CEO Elon Musk revealed it was yet holding on to its BTC stash. Tesla Maintains Holdings After Initial Sell-Off In Q2 of 2022, Tesla opted to sell 75% of all its BTC. The car manufacturer received close to $950M in exchange. Notably,…
2 years ago ![]() 1.5 k views
1.5 k views
Here’s When Grayscale Debates the SEC in Court on its Bitcoin Spot ETF
The District of Columbia Court of Appeals has marked a date for when Grayscale and the Securities and Exchange Commission (SEC) may present oral arguments regarding the approval of a Bitcoin spot ETF. Each side will present its case at 9:30 am ET on March 7, with the SEC arguing against the product, and Grayscale arguing in favor. Grayscale VS SEC The court date – revealed in a court order filed on Monday according to CNBC – is much earlier…
2 years ago ![]() 1.8 k views
1.8 k views
Ethereum
Ethereum’s Zhejiang Staking Withdrawal Testnet for Shanghai is Live
At 15:00 UTC on Wednesday, the much-anticipated Zhejiang testnet for staking withdrawal went live on Ethereum’s Beacon chain. Zhejiang will enable the testing of the Ethereum Improvement Proposal (EIP) 4895 which allows for staking withdrawals. This is in preparation for the network’s next major update, the Shanghai hard fork slated to launch sometime in March. Users Can Make Simulated Withdrawals with Zhejiang In a tweet yesterday, DevOps engineer at Ethereum foundation Barnabas Busa gave details about the Zhejiang testnet slated…
2 years ago ![]() 1.6 k views
1.6 k views
Ethereum Devs Disagree Over Technical Tweak as Shanghai Upgrade Nears
Post-merge Ethereum users have been eagerly awaiting the commencement of the network’s next major upgrade, Shanghai. However, after over 3 months of prep time, it appears the Shanghai rollout isn’t going as smoothly as expected. What Exactly is the Shanghai Upgrade? In September last year, the much-publicized Ethereum Merge also known as the Ethereum 2.0 upgrade went live. Ethereum underwent some significant changes as its consensus mechanism transitioned from proof-of-work to a cost-efficient proof-of-stake system. However, since the Beacon launch…
2 years ago ![]() 1.6 k views
1.6 k views
FTX Hacker Converts 50k Stolen ETH to BTC
Per a report from blockchain analysis firm Chainalysis, the attacker behind the Nov 11 FTX exploit, is converting the stolen ETH to Bitcoin. There were muted fears the seemingly inexperienced perpetrator could dump all its ETH holdings. On Sunday, the attacker dumped 50k ETH on-chain, with ETH's price dipping by almost 7%. https://twitter.com/chainalysis/status/1594349583416840199?s=20&t=pgvQHeVytI20eKQ1ls9bxw Hacker Moves 50,000 ETH to New Address Over the past week, the perpetrator had been steadily swapping the cryptocurrencies they had carted off for Ether tokens. This…
3 years ago ![]() 1.9 k views
1.9 k views
Censorship Concerns: 51% of Ethereum Blocks Now OFAC Compliant
According to new data, over half of the blocks on the Ethereum network now reportedly comply with the US Treasury OFAC’s standards. This comes roughly a month after the platform’s monumental merge update. Phasing Out Tornado Cash The Office of Foreign Assets Control is the intelligence and enforcement agency of the US Treasury Department. Indeed, the OFAC administers and enforces US financial sanctions. A prime example of this is the recent, highly-publicized ban on crypto mixer Tornado Cash. According to…
3 years ago ![]() 1.8 k views
1.8 k views
Trading
How to Leverage Arbitrage Opportunities in Crypto Markets
Cryptocurrency arbitrage has become an increasingly popular investment strategy as the crypto market grows and evolves. Arbitrage involves taking advantage of pricing discrepancies between markets or exchanges to profit. Investors can leverage profit opportunities by understanding cryptocurrency arbitrage while managing associated risks. In this guide, we'll explore cryptocurrency arbitrage and how it works. A Bitcoin-related example will help us illustrate the concepts of this strategy. What is Arbitrage and How Does it Work in Crypto Markets Crypto arbitrage trading is…
2 years ago ![]() 3 k views
3 k views
The Different Types of Copy Trading in Crypto
Are you interested in trading cryptocurrencies but feel intimidated by the complexity of the process? Copy trading is a great way to get into crypto without needing to be an experienced trader. With copy trading, investors can benefit from the experience and knowledge of more experienced traders, allowing even beginners to succeed. How does copy trading work, and which tips do you need to know to succeed? In this article, we'll explore all aspects of copy trading in crypto. What…
2 years ago ![]() 1.7 k views
1.7 k views
How to Spot an Unsafe Crypto Exchange
Cryptocurrency exchanges have become increasingly popular as they provide a platform for people to buy and sell digital assets. Unfortunately, not all crypto exchanges are safe or reliable. With the rise of cybercrime and fraud, you must learn to spot an unsafe crypto exchange before investing your money. This guide will help beginners identify and avoid potential risks when selecting a cryptocurrency exchange. The Role of Crypto Exchanges on the Digital Assets Market Cryptocurrency exchanges play a crucial role in…
2 years ago ![]() 2.2 k views
2.2 k views
What Is Grid Trading in Crypto?
Crypto grid trading has become a popular strategy because of its ability to help traders capitalize on market volatility. Grid trading means you can produce consistent profits by taking advantage of price differences in different markets or time frames. By establishing buy and sell orders at predetermined intervals, you can take advantage of these fluctuations in an automated way. This guide will explore the different aspects of grid trading and provide an overview of its benefits, challenges, and more. Through…
2 years ago ![]() 1.6 k views
1.6 k views
Tech
Introducing una Messenger: A Paradigm Shift in Blockchain Connectivity
The digital landscape is set for an unprecedented transformation with the introduction of una Messenger, the latest innovation from web3 development powerhouse Wemade. This platform represents an evolution of the "PAPYRUS Messenger," serving as the cornerstone of the ambitious "unagi" initiative, aimed at catalyzing the mass adoption of blockchain technology. The "Unbound Networking & Accelerating Growth Initiative" seeks to bridge the divides between diverse blockchain services and networks, heralding a new era of interconnectedness. A New Frontier in Blockchain Communication…
Marius Bogdan Dinu
@bdinu89
@bdinu89
1 year ago ![]() 574 views
574 views
Bit2Me Champions WEMIX Token in Pioneering European Listing
Bit2Me, Spain's premier virtual asset exchange, has recently broadened the horizons for cryptocurrency enthusiasts by listing WEMIX, the cornerstone token of the WEMIX3.0 blockchain ecosystem. This marks a notable achievement as WEMIX's inaugural venture into the European market, emphasizing the token's role in facilitating a range of blockchain-based activities, from gaming transactions to decentralized finance (DeFi) applications. Launched with the intention to democratize access to WEMIX for the 450 million Spanish speakers around the globe, this strategic move aligns with…
Marius Bogdan Dinu
@bdinu89
@bdinu89
1 year ago ![]() 404 views
404 views
CryptoVirally Expands with Fresh Crypto Marketing Offers and Cointelegraph Upgrades
In an exciting update for the cryptocurrency marketing landscape, CryptoVirally has announced a series of new entries and enhancements to its already comprehensive range of services. These updates, aimed at providing tailored marketing solutions for crypto projects, include new limited-time offers and expanded options for Cointelegraph publications. Limited Offers: A Game-Changer in Crypto Marketing CryptoVirally's limited offers section presents an enticing opportunity for crypto projects to leverage high-impact marketing services at discounted rates. These offers, available for a limited period,…
Marius Bogdan Dinu
@bdinu89
@bdinu89
1 year ago ![]() 465 views
465 views
Breaking Boundaries in Blockchain: WEMIX’s ‘una Wallet’ Sets New Standard for Multi-Chain Asset Management
The WEMIX Foundation has unveiled 'una Wallet,' a revolutionary digital wallet designed to offer unparalleled convenience and security in managing digital assets across various blockchain networks. The announcement, made on January 17, 2024, signifies a new era in the seamless integration of multiple blockchain protocols, including Arbitrum, Avalanche, BNB Smart Chain, Ethereum, Kroma, Optimism, Polygon, and WEMIX3.0. 'una Wallet' is more than just a digital wallet; it represents the culmination of WEMIX's innovative efforts in the blockchain space. It serves…
Marius Bogdan Dinu
@bdinu89
@bdinu89
1 year ago ![]() 592 views
592 views